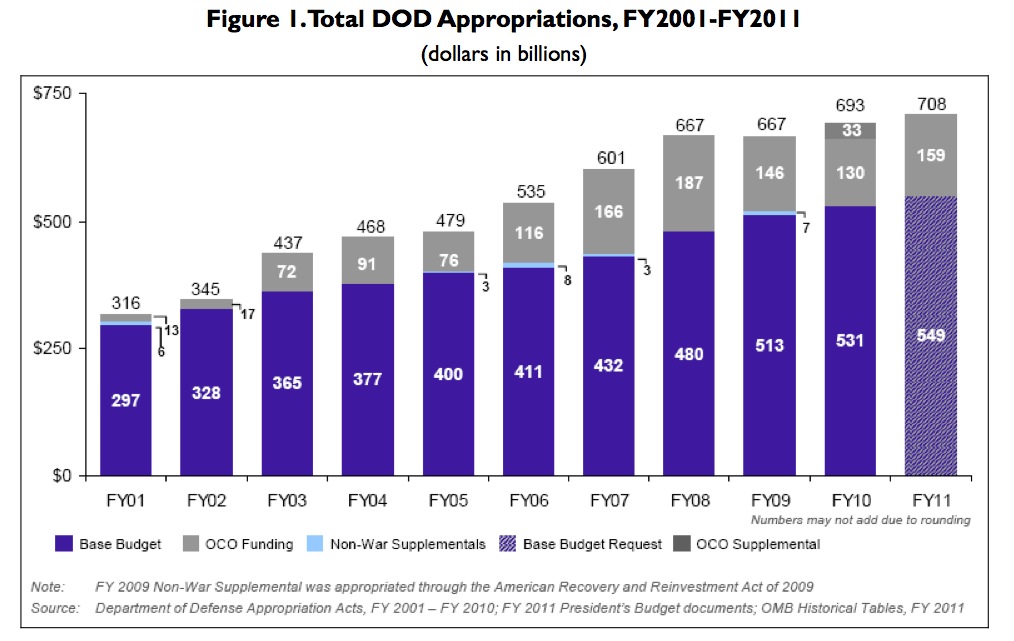
Browsing a Congressional Research Service report on the various versions of the latest US Department of Defense budget, I was struck by this chart showing the steady growth in total military spending since 9/11.
The gray segment of each bar represents funding for “overseas contingency operations,” the currently acceptable bureaucratic euphemism for the wars in Iraq and Afghanistan.
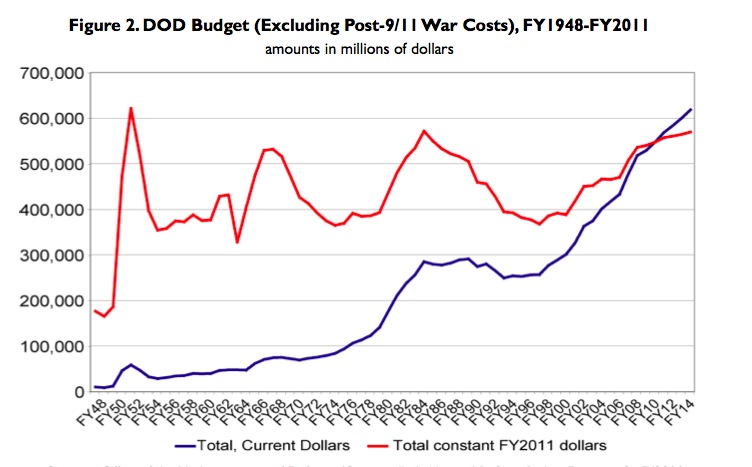
Another chart in the report tracks the military budget since the end of World War II. The red line shows spending adjusted for inflation.
 Unfortunately, whoever designed this chart decided to leave out the costs of the Iraq and Afghanistan wars, to misleading effect. I adapted the chart to include those war costs, here, in green:
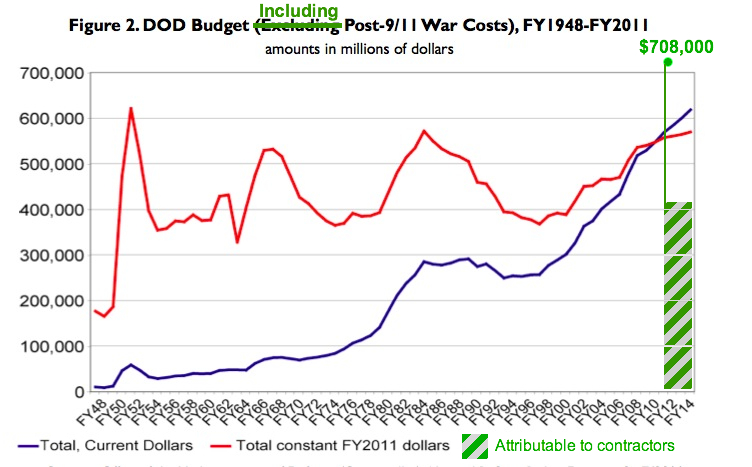 The striped green bar in the lower righthand corner shows how much of the current military budget gets spend on private contractors for “goods and services,” according to Defense Secretary Robert Gates. That’s roughly $400 billion a year.
To put that in perspective, I made one last addition to the chart.
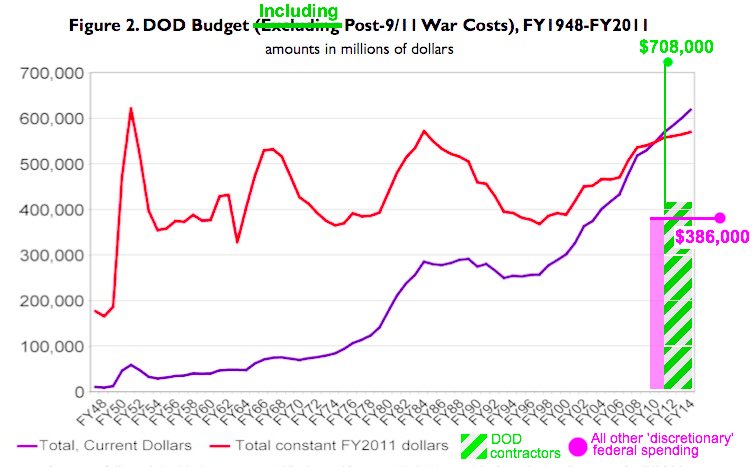
The purple bar tops off at the Obama administration’s fiscal year 2011 budget request for what it calls “Non-Security Discretionary Budget Authority.”
That category includes the departments of
Agriculture
Commerce
the Census Bureau
Education
Energy (but not the National Nuclear Security Administration)
Health and Human Services
Housing and Urban Development
Interior
Justice
Labor
State and other international programs (minus $59 billion counted as mandatory “security” spending)
the Transportation Budget Authority
the Army Corps of Engineers
the Environmental Protection Agency
the General Services Administration
the National Aeronautics and Space Administration
the National Science Foundation
the Small Business Administration
the Social Security Administration (not the Social Security trust fund itself)
the Corporation for National and Community Service
The category excludes the NNSA (which manages the nuclear weapons complex), the Defense and Homeland Security Departments, Veterans Affairs and most of the State Department. It also excludes Medicare, Medicaid and Social Security funds.
The takeaway here is that every year, more taxpayer money gets shoveled into the hands of defense contractors than gets spent on more or less the entire civilian side of the US federal government—from highways to public schools to housing projects to farm subsidies.
Last year, one company, Lockheed Martin, got $31 billion in Pentagon contracts—$6 billion more than the budget for the US Department of Agriculture.
No other country spends nearly so much on its military, to say nothing of military contractors.
—
Here’s the CRS report from which these charts were adapted (pdf). And here’s a Washington Post item on a proposal to cut the military budget by 55 members of Congress.